histoGraph
Interactive Networks for Digital Cultural Heritage Collections
histoGraph is a web platform designed to help researchers to explore large multimedia archives. In this article we briefly introduce the functionality of histoGraph, a technical demonstrator exploiting the surplus value of human touch for the identification of identities in historical image collections through a hybrid crowd-sourcing approach. In Network visualization for Digital Humanities we can distinguish between two general perspectives: visualizations can be used to illustrate specific insights based on existing knowledge or to explore data and to discover something that is not yet known.
Within this larger concept of visual analytics we can see two perspectives: one that stipulates the idea of a holistic or “bigger” picture, so that we can gain insight by combining different information into one image (seeing the forest for the trees) and one that focuses on identifying the peculiar in a massive amount of information. We propose to build a bridge between the two: on the one hand an analytical tool to identify peculiarities and on the other an authoring tool for visual storytelling. This would offer us an interesting cross-connection with the idea of enhanced publication as it is understood by the Driver project.
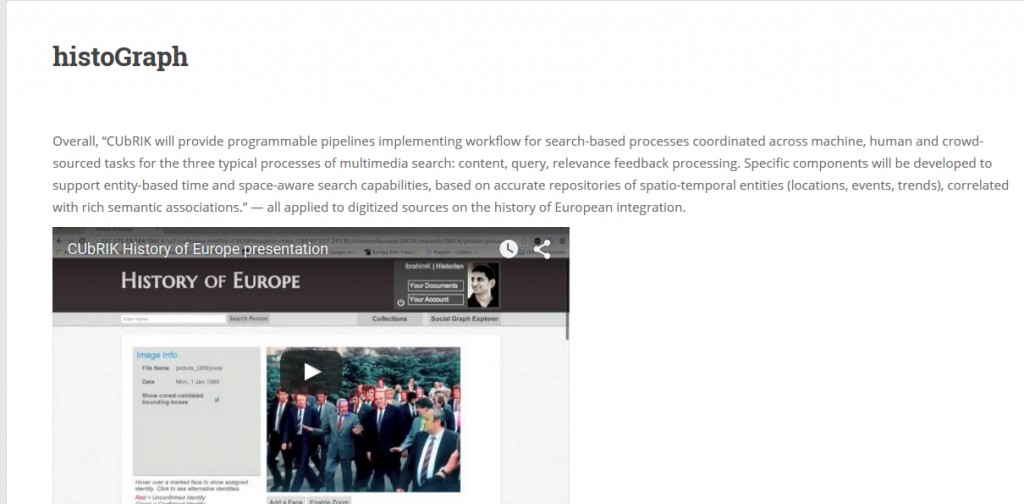
histoGraph was developed by the FP7-funded project CUbRIK which focused on advanced multimedia search technologies. Alongside an app for exploring and searching fashion, histoGraph is one of two demos which implement the different modules. The current version creates a social network of people who appear in photos related to the history of European integration and automatically enriches the network with relevant sources based on keyword queries in full text. A demo is available online. To create the network, faces in the historical photos need to be identified, a very challenging task for machines. Humans and machines therefore share this work and the input from one improves the performance of the other. histoGraph introduces an effective interface to access collections of historical sources and to discover links among and entities within them.

histoGraph, Screenshot 14.9.2015
The integration of human expertise and machine computation opens up new possibilities to create a new type of applications. So far however, this potential remains largely untapped because of the significant requirements for such projects: The implementation and integration of advanced algorithms, for example for the identification of faces, requires specialized know-how and users from the humanities are challenged with defining unprecedented tasks for methods which haven’t even emerged yet. histoGraph combines new approaches to engage the public to commit to humanities research, to facilitate exchange between users and to help us reach our audiences.
histoGraph is based on a collection of more than 3000 images which represent the main events and actors in the history of European integration. This image collection is hosted by the CVCE. To prepare the photos for the network, we use an image indexation pipeline which detects the location of individual faces in the photographs. A crowd of “click-workers” with no specific training double-checks whether the algorithms detected faces correctly or whether it missed some. In the next step, an automatic face recognition process is triggered that associates each of the now verified faces with a list of ten possible identities. This list of candidates is then disseminated for example through Twitter to a crowd of experts who vote for and comment on their preferred identity. The image metadata, for example the names of persons, the time or the place where an image was taken as well as contextual information about associated historical events can be reviewed by expert users and delegated to a crowd of specialists on the history of European Integration for review.
Based on the co-occurrence of persons in images, a social network is calculated which links individual persons with each other. Connections gain in strength the more often persons appear together in an image. Users can interact with histoGraph in different ways, e.g. a click on a node leads to an ego-network of the selected person and a click on an edge displays documents, which mention both actors. This feature is powerful since it guides users back to the primary sources on which a tie is based on and thereby makes it easier to understand what a tie and a node represent. Many of the documents stored in our collection come with a date of creation. This allows us to filter the network so it only displays connections of documents created within certain time spans.
As introduced above a challenge for histoGraph and the Digital Humanities in general is the conception of truth. Scientists can rely on a more or less stable foundation of what is true. Any experiment can be replicated and measured precisely. In the humanities the concept of truth is far more complex: It is based on the insight, that there is no neutral or objective way to study human environments. The way in which questions are asked, when, by whom, how data is selected to answer them, by what means this data is analyzed and finally the way in which the results of such analyses are communicated and received all challenge the idea of “one truth”. Persons may, for example, change careers, their home countries might be renamed or they choose to go by different names. This means that at different points in time there might be more than one “true” answer to the simple question “Who is this?” In order to represent the discursive nature of truth in the humanities we make use of a community-driven tool for question answering, similar to stackoverflow.com.
Users have the opportunity to answer questions and thus benefit from the knowledge within the expert crowd. We envision that histoGraph fills this niche and becomes a general purpose context exploration and storytelling tool for research and teaching in cultural heritage, the humanities and journalism. Crucially, histoGraph will maintain its current ability to process photos and will also become capable of processing text documents and metadata.
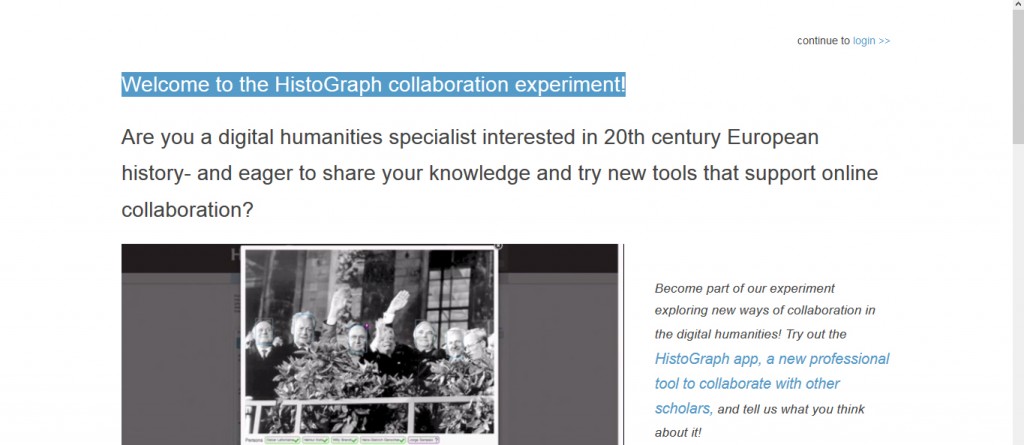
histoGraph collaboration experiment
Digital Humannities LAB at CVCE

histoGraph, Screenshot 14.9.2015


Sir,
i need how to make the histograph bar chart with its calculation for projects.
Waiting your reply.
Thanking you.
Hi, I wonder whether you are lookin for something like this https://support.microsoft.com/en-us/kb/214269 ?